Hyperinflation/Archive

Cases / World War II / Greece

Greece
1941–1945

Under German, Italian and Bulgarian occupation, the Greek state could not tax but had to pay the occupiers' monthly costs in drachmas, and the Bank of Greece printed them.

13,800%prices in the worst monthOctober 1944
4.27 daysfor prices to doubleat the peak (Hanke & Krus)
May 1941 – Dec 1945above 50% a monththe hyperinflation itself
3banknotes in the collectionDrachma

Currency reform: 1 new drachma = 50 billion old · Cause: Occupation costs paid by the Bank of Greece · Resolution: British support, gold sovereign sales, devaluation (1946)

In short

Prices rose for four years in waves. The worst month was October 1944, when the occupation ended: 13,800 %, with prices doubling every 4.27 days (H&K). A first redenomination in November 1944 (50 billion old drachmas = 1 new) failed. Stability only came in 1946, with British support and gold sovereigns sold to the public.

The curve

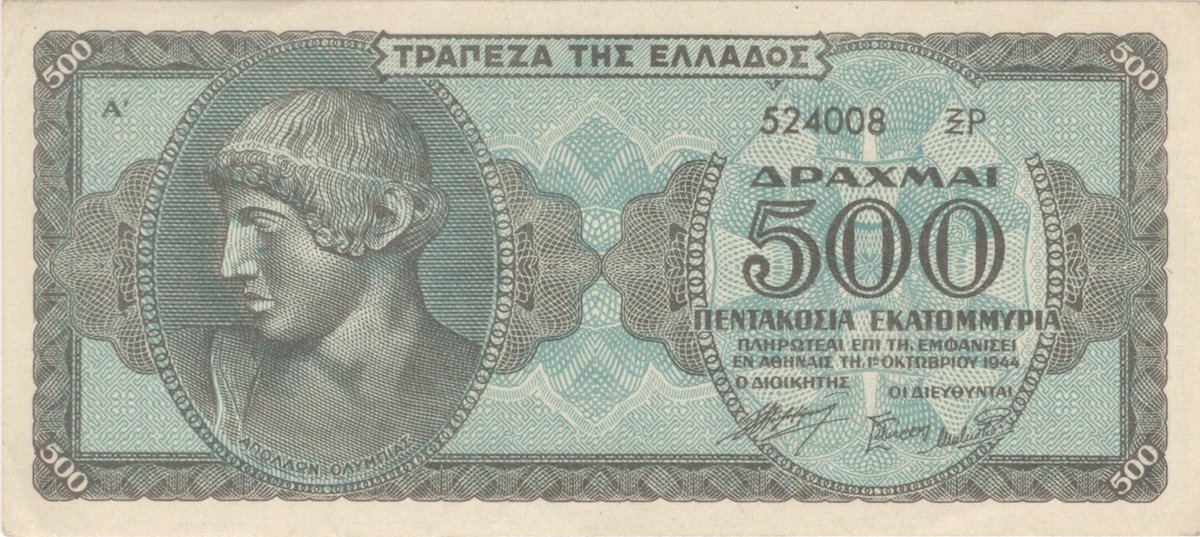
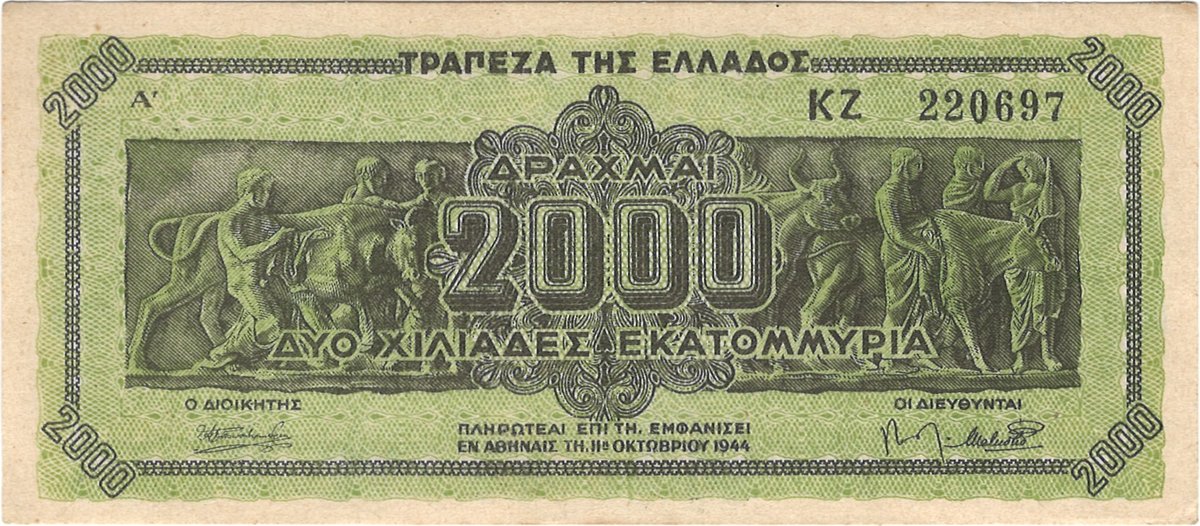
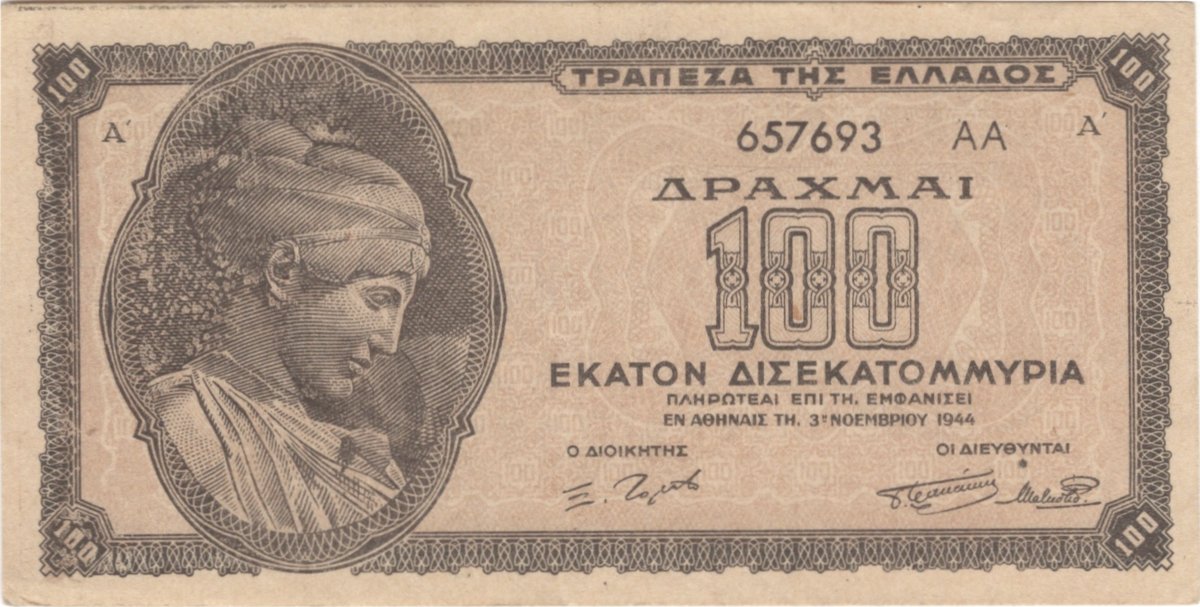
Drachmas per 1 USD (estimated from price indices), logarithmic scale: each line up is many times the one below. The small squares are the banknotes, at the month dated on them.

100 10,000 1 million 100 million 10 billion 1 trillion 100 trillion 10¹⁶ 1942 1943 1944 1941-04: 150 1941-12: 1,100 1942-06: 6,500 1942-12: 19,000 1943-06: 95,000 1943-12: 2 million 1944-03: 35 million 1944-06: 1.5 billion 1944-08: 50 billion 1944-09: 1.5 trillion 1944-10: 245 trillion 1944-11: 4×10¹⁵ Worst month

Occupation from April 1941 to October 1944. Peak 13,800% in October 1944, prices doubling every 4.27 days (Hanke & Krus). Largest note: 100 trillion drachmas. On 11 November 1944, 50 billion old drachmas became 1 new drachma. Approximate series, kept for its shape; individual points are not sourced one by one. Source: Bank of Greece, Makinen, G. (1986) The Greek Hyperinflation.

What happened

The events in order, with the banknotes at the date on them.

Oct 1940
Italy invades, and borrowing from the central bank begins.
May 1941
Monthly inflation passes 50 % (H&K start).
Nov 1942 – Feb 1943
Hermann Neubacher, an envoy of the occupiers, runs a programme that brings prices down by five-eighths (Wikipedia).
Oct 1943
Prices rise more than 50 % a month again after Italy leaves the war.
Aug 1944
534 % in the month.
Oct 1944
Peak: 13,800 % (H&K). Athens is liberated on 12 October.
dated
1 Oct 1944
500 million drachmas (1 Oct 1944)
dated
11 Oct 1944
2 billion drachmas (11 Oct 1944)
dated
3 Nov 1944
100 billion drachmas (3 Nov 1944)
11 Nov 1944
The Waley plan sets the new drachma at 50 billion old ones, convertible at 600 to the pound sterling.
4 Jun 1945
A second stabilisation plan (Varvaressos).
Dec 1945
Monthly inflation is above 120 % again (Wikipedia). The H&K episode ends.
1946
A Currency Committee is set up; Britain writes off £46 million of wartime loans; the drachma is devalued by 50 %; gold sovereigns are sold to the public.
Context: why it happened

  • War before the occupation. After Italy invaded in October 1940, the government borrowed from the Bank of Greece: notes in circulation rose 72 % by April 1941 (Wikipedia).
  • Occupation costs. The occupiers took exports and charged the Greek state monthly payments in drachmas, and the state had no way to raise that money through taxes.
  • A broken country. Greece was split into three occupation zones, which cut trade and food supplies.

Life during it

  • People priced things in gold sovereigns and trusted those, not the drachma. Selling sovereigns in 1946 worked because they were the money people already used.

How it ended

The new drachma of 1944 failed because the deficit kept running. Stability came in 1946 from three things together: foreign support (the British write-off), a devaluation, and sales of gold sovereigns that took about a third of the drachmas out of circulation that would otherwise have been there by the end of 1948 (Wikipedia, after Makinen).

Consequences & lessons

  • Removing zeros (November 1944) changes nothing while the state keeps printing to pay its bills.
  • When the public already trusts a hard money (the sovereign), the fix is to supply it. Here, a currency reform first meant giving people what they already used as money.

The banknotes

The data

figurevaluesource
Hyperinflation (≥ 50%/month)May 1941 – Dec 1945 (in waves)H&K
Peak monthOctober 1944H&K
Peak monthly inflation13,800 %H&K
Doubling time at peak4.27 daysH&K
Monthly inflation, Aug 1944534 %Wikipedia (Greek hyperinflation)
Largest note issued100 trillion (10¹⁴) drachmas, 1944Wikipedia (Greek hyperinflation)
Redenomination11 Nov 1944: 1 new = 50,000,000,000 old drachmasWikipedia (Greek hyperinflation)
The series, point by point
Monthper $
1941-04150
1941-121,100
1942-066,500
1942-1219,000
1943-0695,000
1943-122 million
1944-0335 million
1944-061.5 billion
1944-0850 billion
1944-091.5 trillion
1944-10245 trillion
1944-114×10¹⁵
Cite this case
“Greece 1941–1945”, Hyperinflation Archive, hyperinflation.rogzy.org/greece-1941-1944/ (2026). Figures: Hanke & Krus (2012) and the sources listed below.

Sources

  1. Hanke & Krus (2012), World Hyperinflations, Cato WP no. 8 — episode, peak, doubling time.
  2. Wikipedia, "Greek hyperinflation" (read 2026-10-05): https://en.wikipedia.org/wiki/Greek_hyperinflation
  3. Makinen, G. E. (1986), "The Greek Hyperinflation and Stabilization of 1943–1946", Journal of Economic History 46(3).
  4. Palairet, M. (2000), The Four Ends of the Greek Hyperinflation of 1941–1946, Museum Tusculanum Press.

H&K = Hanke, S. H. & Krus, N. (2012), World Hyperinflations, Cato Institute Working Paper no. 8.

Further reading

More in the Library. Books, covers and descriptions from Plan B Network’s open educational content, CC BY-SA 4.0, with titles, names and punctuation corrected.