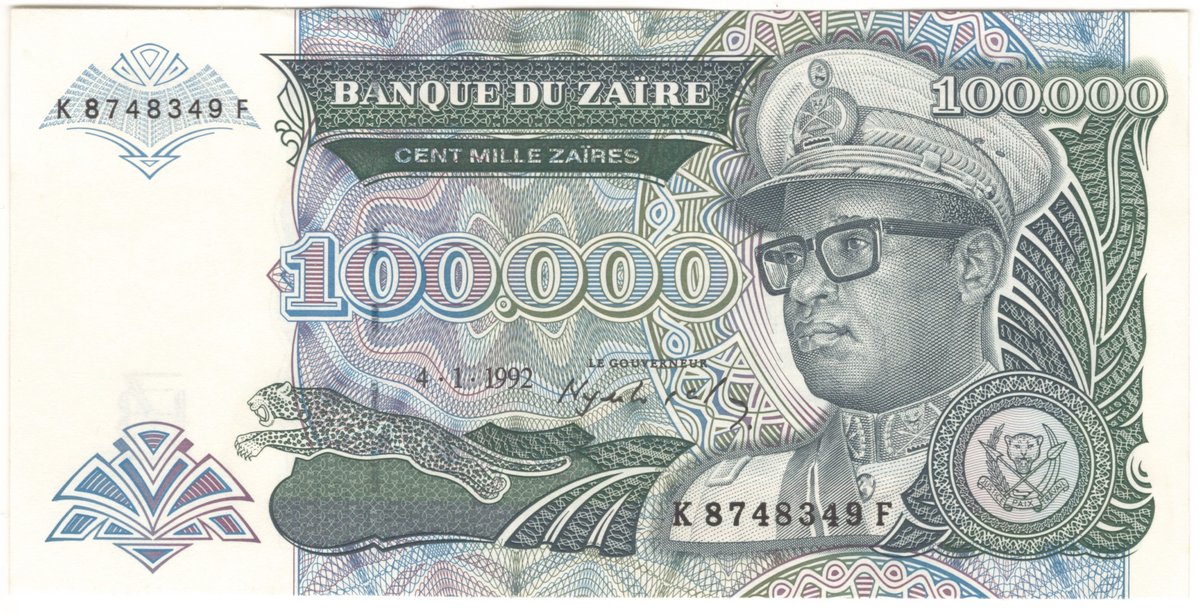
4 Jan 1992

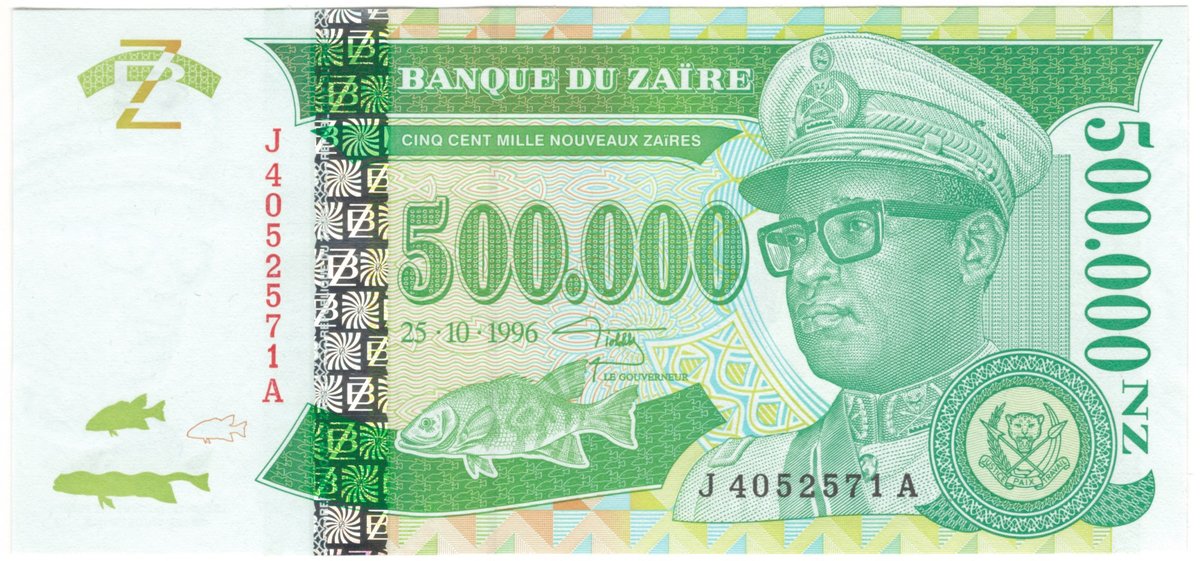
1996

Cases / Wars in Africa / Zaire
Two hyperinflations in three years, under a regime that financed itself, its army and its patronage with the printing press while copper output collapsed.
Currency reform: 1 nouveau zaïre = 3,000,000 zaïres · Cause: A state financed by the printing press, collapsing exports · Resolution: Two episodes; the Congolese franc replaced the zaïre in 1998
The first ran from late 1991 to 1992; the second followed the botched launch of the nouveau zaïre (October 1993, three million old zaïres for one new) and peaked at once: 250 % in November 1993, doubling every 16.8 days (H&K).
Zaïres per 1 USD (nouveau zaïre converted back, ×3,000,000), logarithmic scale: each line up is many times the one below.
Two hyperinflations: Oct 1991–Sep 1992 and Nov 1993–Sep 1994, peak 250% in November 1993 (Hanke & Krus). The nouveau zaïre (Oct 1993) was worth 3,000,000 old zaïres; later points are converted back. Rates of 1991, Dec 1992 and Mar 1993 from Wikipedia ("Zairean zaire"); the rest approximate. Source: Wikipedia, "Zairean zaire", Banque du Zaïre.
The events in order, with the banknotes at the date on them.


Savings worth $1,000 in January 1990, kept in Zaïre, were worth $0.000000319556 in September 1994.
| figure | value | source |
|---|---|---|
| First episode | Oct 1991 – Sep 1992, peak Nov 1991, 114 % | H&K |
| Second episode | Nov 1993 – Sep 1994 | H&K |
| Peak month | November 1993 | H&K |
| Peak monthly inflation | 250 % | H&K |
| Doubling time at peak | 16.8 days | H&K |
| Zaïres per USD | 15,300 (1991) · 114,291 (early 1992) · 1,990,000 (Dec 1992) · 2,529,000 (Mar 1993) | Wikipedia (Zairean zaire) |
| Largest notes | 5,000,000 zaïres (late 1992) · 1,000,000 NZ (1996) | Wikipedia (Zairean zaire) |
| Nouveau zaïre | Oct 1993, 1 NZ = 3,000,000 zaïres | Wikipedia (Zairean zaire) |
| Congolese franc | 1 Jul 1998, 1 franc = 100,000 NZ | Wikipedia (Zairean zaire) |
| Month | old zaïres/USD |
|---|---|
| 1990-01 | 719 |
| 1990-12 | 3,000 |
| 1991-06 | 8,500 |
| 1991-08 | 15,300 |
| 1991-12 | 55,000 |
| 1992-06 | 450,000 |
| 1992-12 | 1.99 million |
| 1993-03 | 2.53 million |
| 1993-10 | 3 million |
| 1993-12 | 330 million |
| 1994-06 | 7.5 billion |
| 1994-09 | 2.25 trillion |
H&K = Hanke, S. H. & Krus, N. (2012), World Hyperinflations, Cato Institute Working Paper no. 8.