Hyperinflation/Archive

Cases / The 21st century / Venezuela

Venezuela
2016–2022

A state that lived on oil spent as if prices would stay high.

192%prices in the worst monthJanuary 2019
Nov 2016 – early 2022 (BCV)above 50% a monththe hyperinflation itself
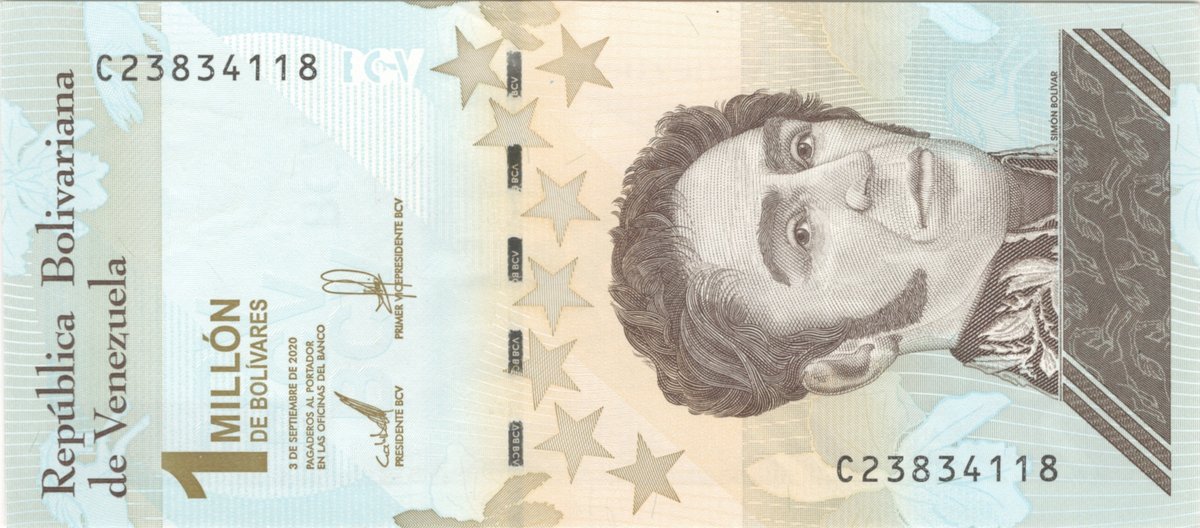
1banknotes in the collectionBolívar

Currency reform: 14 zeros removed (2008, 2018, 2021) · Cause: Oil collapse, price controls, a deficit paid by the central bank · Resolution: De facto dollarisation; technically over in early 2022

In short

When oil fell in 2014–15, it covered the gap with the central bank, while price and exchange controls had been emptying the shops since 2003. Hyperinflation began in November 2016 and only ended technically in early 2022. The highest monthly figure found so far is 192 % in January 2019 (National Assembly estimate). Inflation figures for 2018 range from 130,060 % to 1,698,488 % depending on the source. The bolívar lost 14 zeros in three redenominations (2008, 2018, 2021), and the economy turned to the dollar.

The curve

Bolívares fuertes per 1 USD, parallel market (bolívar soberano converted back, ×100,000), logarithmic scale: each line up is many times the one below.

1,000 100,000 10 million 1 billion 100 billion 2017 2018 2019 2020 2021 2016-02: 1,000 2016-06: 1,800 2016-12: 4,300 2017-03: 6,500 2017-07: 10,000 2017-09: 20,000 2017-12: 105,000 2018-03: 245,000 2018-06: 3.5 million 2018-08: 6 million 2018-10: 10 million 2019-01: 100 million 2019-07: 1 billion 2020-04: 10 billion 2020-11: 100 billion 2021-08: 415 billion Worst month

The bolívar soberano (20 Aug 2018) removed five zeros and the bolívar digital (Oct 2021) six more; later points are converted back into bolívares fuertes. Parallel-market rates, far above the official ones. Approximate series, kept for its shape; individual points are not sourced one by one. Source: Parallel-market rate as published by DolarToday, Federal Reserve Bank of St. Louis (FRED).

What happened

The events in order, with the banknotes at the date on them.

2003
Exchange and price controls are introduced.
2008
The bolívar fuerte (1,000 : 1).
2014–2015
Oil prices collapse.
Nov 2016
Hyperinflation begins.
2018
Annual inflation estimated between 130,060 % and 1,698,488 %, depending on the source.
20 Aug 2018
The bolívar soberano (100,000 : 1).
2019
De facto dollarisation; controls are loosened.
Jan 2019
192 % in the month (National Assembly).
dated
3 Sep 2020
1 million bolívares (3 Sep 2020)
Oct 2021
The bolívar digital (1,000,000 : 1).
Q1 2022
12 months below 50 % a month: the hyperinflation is technically over.

Context: why it happened

  • Dependence on oil. Oil was almost all of Venezuela's exports. The 2014 price collapse cut both its dollar income and its tax revenue.
  • Price controls (since 2003) and exchange controls. Shortages, smuggling, and a black-market dollar whose rate became the real price of everything.
  • The central bank financed the state. The money supply grew 64 % in 2014, three times faster than in any other economy (Wikipedia).

How it ended

There was no single reform. The end came from de facto dollarisation: prices, wages and savings moved to the dollar, and the state loosened controls and slowed the printing press.

Consequences & lessons

  • Official statistics stop being credible. Each figure has a source that has to be named.

The banknotes

The data

figurevaluesource
StartNov 2016; 57th entry in the Hanke-Krus table (Dec 2016)Wikipedia (Hyperinflation in Venezuela)
Highest monthly figure found192 %, Jan 2019 (National Assembly)Wikipedia (Hyperinflation in Venezuela)
2018, annualBCV 130,060 % · IMF 929,790 % · National Assembly 1,698,488 %Wikipedia (Hyperinflation in Venezuela)
Redenominations2008 1,000 : 1 · 20 Aug 2018 100,000 : 1 · Oct 2021 1,000,000 : 1Wikipedia (Hyperinflation in Venezuela)
End12+ months below 50 %/month reached in Q1 2022 (BCV)Wikipedia (Hyperinflation in Venezuela)
Dollarisation≈ 54 % of transactions in US$ (Sep 2019, Econalítica)Wikipedia (Hyperinflation in Venezuela)
Emigration4.8 million refugees and migrants (UNHCR, as cited)Wikipedia (Hyperinflation in Venezuela)
The series, point by point
Monthbolívares fuertes/USD
2016-021,000
2016-061,800
2016-124,300
2017-036,500
2017-0710,000
2017-0920,000
2017-12105,000
2018-03245,000
2018-063.5 million
2018-086 million
2018-1010 million
2019-01100 million
2019-071 billion
2020-0410 billion
2020-11100 billion
2021-08415 billion
Cite this case
“Venezuela 2016–2022”, Hyperinflation Archive, hyperinflation.rogzy.org/venezuela-2016-2021/ (2026). Figures: Hanke & Krus (2012) and the sources listed below.

Sources

  1. Wikipedia, "Hyperinflation in Venezuela" (read 2026-10-05): https://en.wikipedia.org/wiki/Hyperinflation_in_Venezuela

H&K = Hanke, S. H. & Krus, N. (2012), World Hyperinflations, Cato Institute Working Paper no. 8.