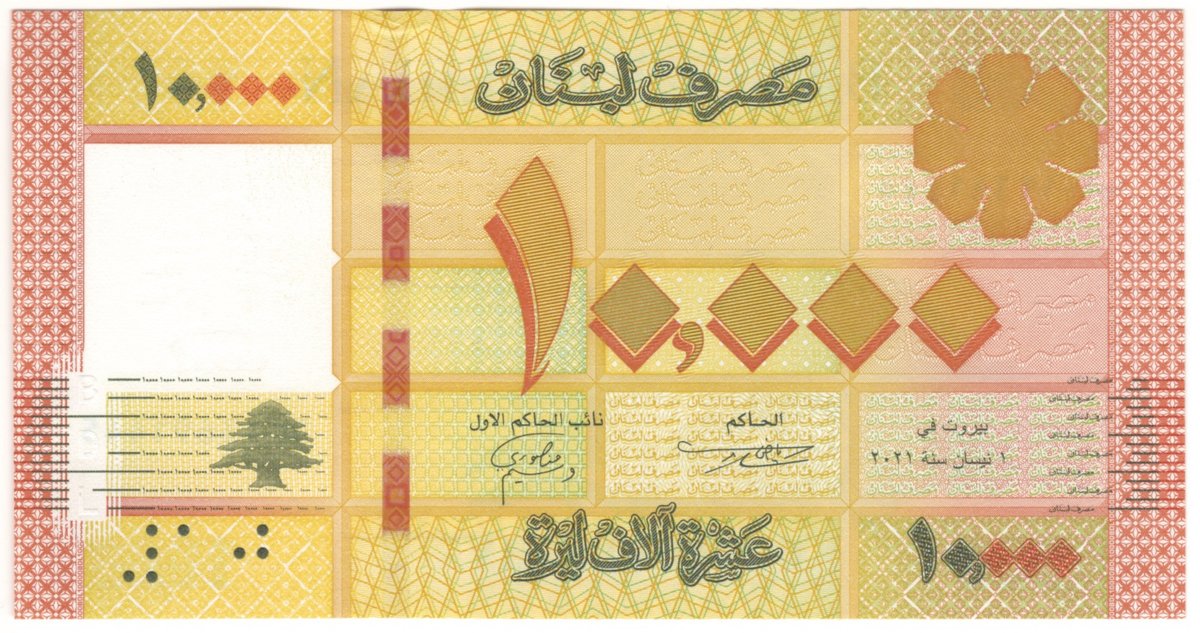
2021

Cases / The 21st century / Lebanon
For 22 years the pound was pegged at 1,507.5 to the dollar. The peg was held up by deposits that banks lent to the central bank, which used them to fund the state, under a system its critics compare to a Ponzi scheme.
Currency reform: None — the pound still runs · Cause: Banking collapse behind a fixed peg · Resolution: Stable rate since mid-2023; deposits still frozen
In 2019 the dollars stopped coming. Banks froze withdrawals, the state defaulted (March 2020), and the parallel rate went from 1,500 to about 140,000 in March 2023. Steve Hanke counted it as hyperinflation no. 62, at 52.6 % a month (implied) in July 2020. Official monthly inflation never reached 50 %, but annual inflation reached 221 % in 2023.
Lebanese Pounds per 1 USD (parallel market rate), logarithmic scale: each line up is many times the one below.
Pegged at 1,507.5 pounds per dollar from 1997 to October 2019. Parallel rate: about 140,000 at its peak in March 2023, stable near 89,500 since mid-2023. Inflation was 221% in 2023 (Wikipedia). Source: DolarToday Lebanon (lebanese-lira.org), Lira Rate, BLOMINVEST Bank.
The events in order, with the banknotes at the date on them.

The rate has been stable since mid-2023 at about 89,500 per dollar, so the site closes the period at 2023.
Savings worth $1,000 in July 2019, kept in Lebanese Pound, were worth $18 in May 2024.
| figure | value | source |
|---|---|---|
| Peg | 1,507.5 LBP/USD, 1997 – Oct 2019 | Wikipedia (Lebanese liquidity crisis) |
| Hyperinflation | 52.6 %/month, implied (from the parallel rate, PPP), Jul 2020 — no. 62 | Hanke, Cato (2020) |
| Parallel rate | 1,600 (Q4 2019) · 3,000 (Apr 2020) · 14,000 (Mar 2021) · 15,200 (Jun 2021) | Wikipedia (Lebanese liquidity crisis) |
| Annual inflation, 2023 | 221.3 % | Wikipedia (Lebanese liquidity crisis) |
| Default | Mar 2020, the first in the country's history | Wikipedia (Lebanese liquidity crisis) |
| Month | per $ |
|---|---|
| 2019-07 | 1,600 |
| 2019-10 | 1,700 |
| 2019-12 | 2,100 |
| 2020-04 | 3,000 |
| 2020-06 | 5,000 |
| 2020-08 | 7,500 |
| 2020-12 | 8,500 |
| 2021-03 | 14,000 |
| 2021-06 | 15,200 |
| 2021-08 | 19,000 |
| 2021-12 | 27,000 |
| 2022-06 | 27,500 |
| 2022-11 | 37,000 |
| 2023-02 | 63,000 |
| 2023-03 | 134,900 |
| 2023-07 | 90,000 |
| 2023-12 | 89,500 |
| 2024-05 | 89,600 |
H&K = Hanke, S. H. & Krus, N. (2012), World Hyperinflations, Cato Institute Working Paper no. 8.