Hyperinflation/Archive

Cases / Latin America's debt crisis / Brazil

Brazil
1986–1994

Brazil lived with inflation of several thousand percent a year for a decade.

82.4%prices in the worst monthMarch 1990
35.1 daysfor prices to doubleat the peak (Hanke & Krus)
Dec 1989 – Mar 1990above 50% a monththe hyperinflation itself
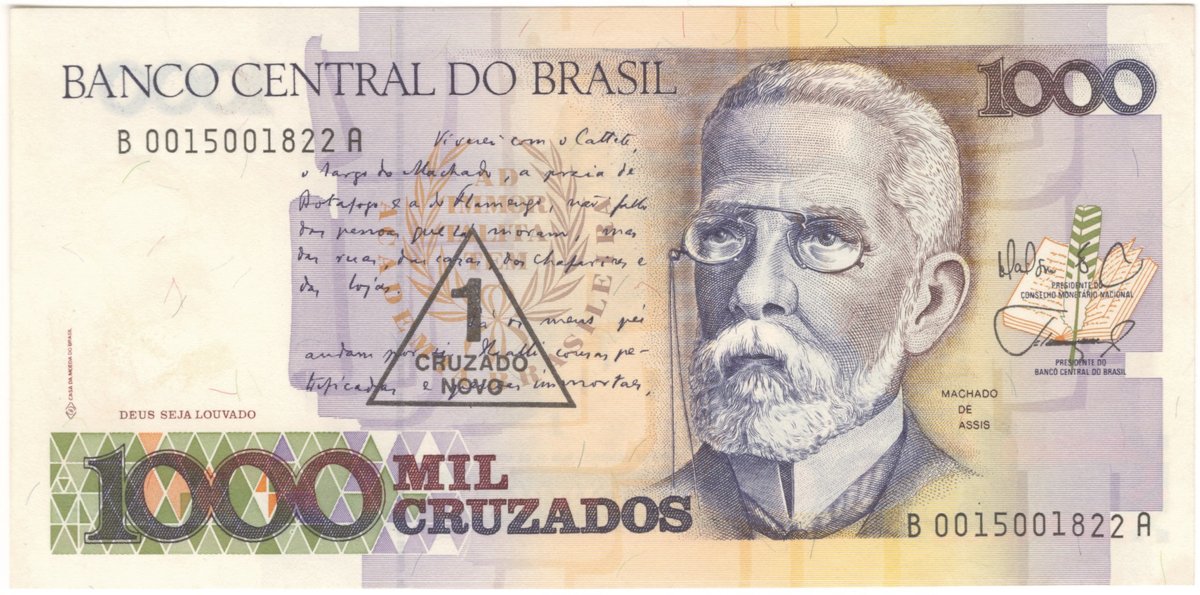
1banknotes in the collectionCruzado / Cruzeiro

Currency reform: 1 real = 2,750 cruzeiros reais · Cause: Indexed economy, deficits, failed price freezes · Resolution: Plano Real: the URV unit of account, then the real (1 Jul 1994)

In short

A heavily indexed economy made it bearable, and five price-freeze plans each failed. By the strict 50 %-a-month definition, hyperinflation lasted only from December 1989 to March 1990, with a peak of 82.4 % in March 1990, doubling every 35.1 days (H&K). The Collor plan then froze 80 % of the country's money in bank accounts. The cure that held was the Plano Real (1994): a unit of account (the URV) first, the new currency after.

The curve

Cruzados per 1 USD (later currencies converted back into cruzados), logarithmic scale: each line up is many times the one below.

10 1,000 100,000 10 million 1 billion 1988 1990 1992 1994 1986-03: 14 1986-12: 15 1987-06: 28 1987-12: 72 1988-06: 185 1988-12: 560 1989-01: 1,000 1989-06: 2,500 1989-12: 9,000 1990-01: 15,000 1990-03: 73,000 1990-06: 95,000 1990-12: 180,000 1991-12: 1.05 million 1992-12: 9.8 million 1993-08: 100 million 1993-12: 400 million 1994-06: 2.75 billion 1994-07: 2.75 billion Worst month

Six currencies in eight years: cruzado (1986), cruzado novo (1989, = 1,000 cruzados), cruzeiro (1990, at par), cruzeiro real (1993, = 1,000 cruzeiros), real (1 Jul 1994, = 2,750 cruzeiros reais). Every point is shown in cruzados so the redenominations do not look like recoveries: one real = 2.75 billion cruzados. Approximate series, kept for its shape; individual points are not sourced one by one. Source: Banco Central do Brasil.

What happened

The events in order, with the banknotes at the date on them.

28 Feb 1986
The Cruzado Plan: a price freeze and the new cruzado.
12 Jun 1987
The Bresser Plan.
dated
1989
1,000 cruzados, overprinted "1 cruzado novo" (1989)
15 Jan 1989
The Summer Plan (Plano Verão) and the cruzado novo.
Dec 1989
Monthly inflation passes 50 % (H&K start).
16 Mar 1990
The Collor Plan freezes about 80 % of all liquidity in bank accounts; the cruzeiro returns. Monthly inflation falls from 81.3 % (March) to 11.3 % (April). It rises again after July 1990.
1993
The cruzeiro real.
Feb – Jun 1994
The URV, a virtual unit of account adjusted daily, while prices move to it.
1 Jul 1994
The URV becomes the real.

Context: why it happened

  • Indexation everywhere. Wages, rents, contracts and bonds were adjusted to past inflation, so last month's inflation became this month's (inertial inflation).
  • Deficits financed with money, the external debt crisis of the 1980s, and plans that froze prices without fixing the budget.

How it ended

The Plano Real fixed what the earlier plans had missed. It did not freeze prices. It first moved every price into a stable unit of account, the URV, and only then turned that unit into money, so indexation unwound on its own.

Consequences & lessons

  • Freezing prices or bank deposits treats the symptom; each freeze cost trust for the next plan.
  • Stability was rebuilt by changing expectations first (the URV), then the money.

The banknotes

The data

figurevaluesource
Hyperinflation (≥ 50%/month)Dec 1989 – Mar 1990H&K
Peak monthMarch 1990H&K
Peak monthly inflation82.4 % (H&K) · 81.3 % (Wikipedia, IPC series)H&K · Wikipedia (Hyperinflation in Brazil)
Doubling time at peak35.1 daysH&K
Monthly, Jan – Mar 199071.9 % · 71.7 % · 81.3 %Wikipedia (Hyperinflation in Brazil)
After Collor (Apr 1990)11.3 %Wikipedia (Hyperinflation in Brazil)
Plano Real48 % (Jun 1994) → 7.8 % (Jul) → 1.9 % (Aug)Wikipedia (Hyperinflation in Brazil)
Redenominationscruzado novo = 1,000 cruzados (1989) · real = 1 URV = 2,750 cruzeiros reais (1 Jul 1994)Wikipedia (Brazilian real)
The series, point by point
Monthcruzados/USD
1986-0314
1986-1215
1987-0628
1987-1272
1988-06185
1988-12560
1989-011,000
1989-062,500
1989-129,000
1990-0115,000
1990-0373,000
1990-0695,000
1990-12180,000
1991-121.05 million
1992-129.8 million
1993-08100 million
1993-12400 million
1994-062.75 billion
1994-072.75 billion
Cite this case
“Brazil 1986–1994”, Hyperinflation Archive, hyperinflation.rogzy.org/brazil-1986-1994/ (2026). Figures: Hanke & Krus (2012) and the sources listed below.

Sources

  1. Hanke & Krus (2012) — episode, peak, doubling time.
  2. Wikipedia, "Brazilian real" (read 2026-10-05): https://en.wikipedia.org/wiki/Brazilian_real
  3. Wikipedia, "Hyperinflation in Brazil" (read 2026-10-05): https://en.wikipedia.org/wiki/Hyperinflation_in_Brazil

H&K = Hanke, S. H. & Krus, N. (2012), World Hyperinflations, Cato Institute Working Paper no. 8.