Cases / The end of communism / Russia
Russia
1992–1994
When the Soviet Union ended, prices had been fixed for decades while savings and money piled up with nothing to buy.
Currency reform: 1 ruble = 1,000 old rubles (1998) · Cause: Price liberalisation releasing a Soviet money overhang · Resolution: One month above 50%, then years of high inflation
In short
On 2 January 1992, Russia lifted most price controls. Prices jumped 245 % in January 1992 (H&K; doubling every 17.0 days), and that single month is the whole hyperinflation by the 50 % definition. But inflation stayed in the thousands of percent for the year, about 2,500 % in 1992, and the ruble kept falling until "Black Tuesday" in October 1994.
The curve
Rubles per 1 USD, logarithmic scale: each line up is many times the one below.
Prices freed on 2 January 1992 rose 245% that month (Hanke & Krus): the only month above 50%. Inflation in 1992 was 2,509% (Wikipedia). In 1998, 1,000 old rubles became 1 new ruble. Approximate series, kept for its shape; individual points are not sourced one by one. Source: Central Bank of Russia, IMF Working Paper - Exchange Rate Determinants in Russia 1992-1993.
What happened
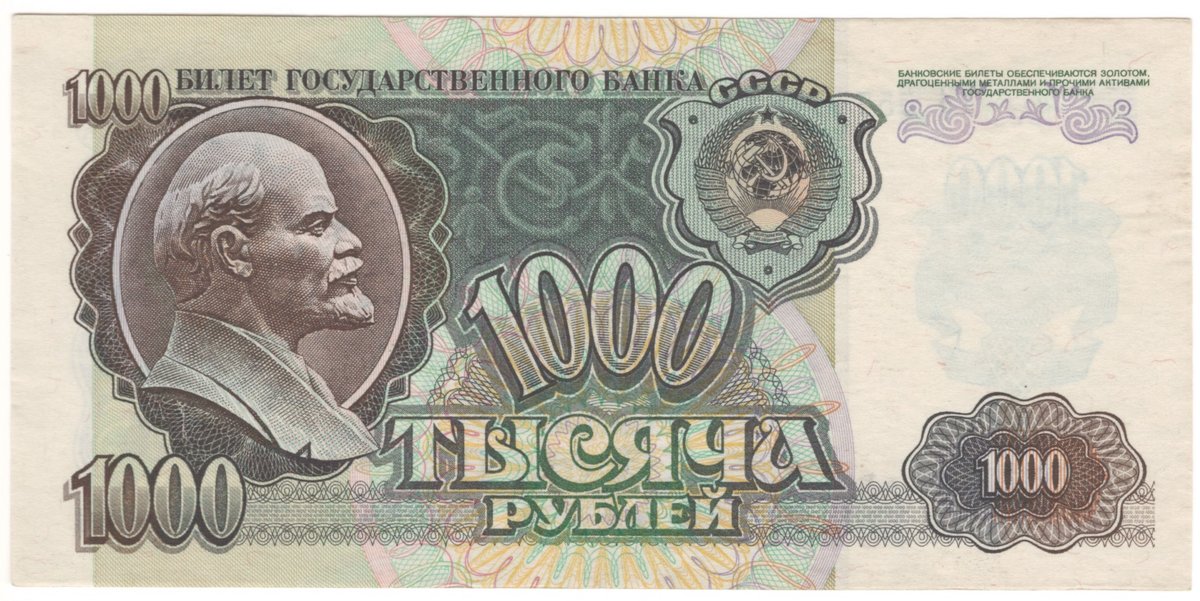
The events in order, with the banknotes at the date on them.
Context: why it happened
- A monetary overhang. Under fixed Soviet prices, households and firms had piled up roubles they could not spend. Freeing prices released that pile all at once.
Consequences & lessons
- Freeing prices does not create inflation, it shows inflation that was already there: the repressed overhang appears in one month.
- One month above 50 % makes it a hyperinflation on paper. What ruined savers was the three years of high inflation that followed.
The banknotes
The data
| figure | value | source |
|---|---|---|
| Hyperinflation (≥ 50%/month) | January 1992 only | H&K |
| Peak monthly inflation | 245 % | H&K |
| Doubling time at peak | 17.0 days | H&K |
| Price liberalisation | 2 Jan 1992 | Wikipedia (Economy of Russia) |
| Annual 1992 | 2,509 % | Wikipedia (Economy of Russia) |
| Redenomination | 1998, 1 RUB = 1,000 RUR | Wikipedia (Russian ruble) |
The series, point by point
| Month | per $ |
|---|---|
| 1992-01 | 110 |
| 1992-04 | 125 |
| 1992-07 | 125 |
| 1992-10 | 350 |
| 1992-12 | 415 |
| 1993-03 | 680 |
| 1993-06 | 1,050 |
| 1993-09 | 1,165 |
| 1993-12 | 1,250 |
| 1994-03 | 1,750 |
| 1994-06 | 1,980 |
| 1994-09 | 2,200 |
| 1994-10 | 3,926 |
| 1994-12 | 3,550 |
“Russia 1992–1994”, Hyperinflation Archive, hyperinflation.rogzy.org/russia-1992-1994/ (2026). Figures: Hanke & Krus (2012) and the sources listed below.
Sources
- Hanke & Krus (2012) — episode, peak, doubling time.
- Wikipedia, "Russian ruble" (read 2026-10-05): https://en.wikipedia.org/wiki/Russian_ruble
- Wikipedia, "Economy of Russia" §1990s (read 2026-10-05): https://en.wikipedia.org/wiki/Economy_of_Russia
H&K = Hanke, S. H. & Krus, N. (2012), World Hyperinflations, Cato Institute Working Paper no. 8.